》View SMM Copper Prices, Data, and Market Analysis
》Subscribe to View SMM Historical Spot Metal Prices
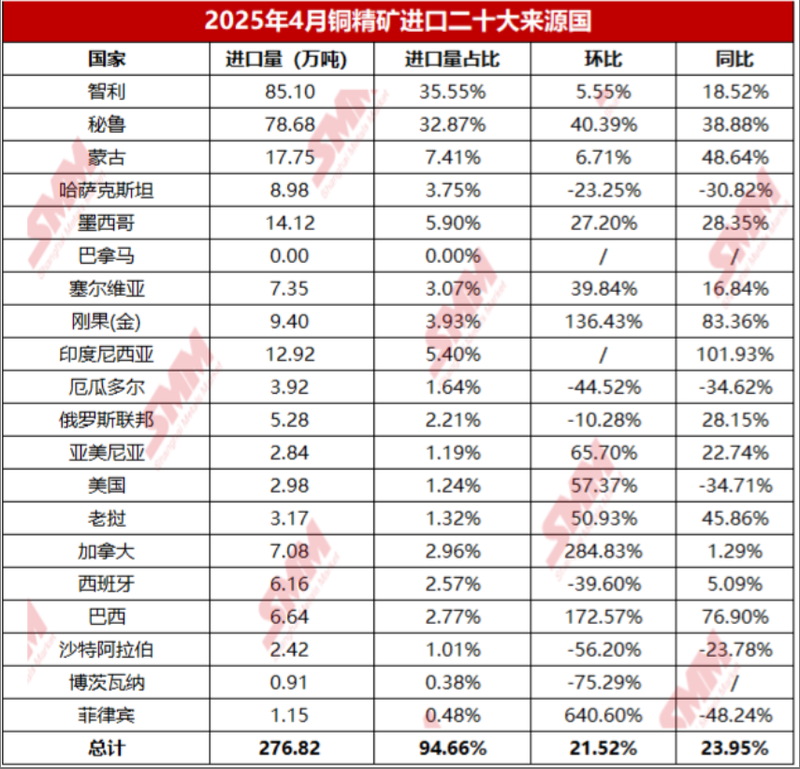
In April 2025, China's imports of copper concentrates reached a record 2.9244 million tons, up 22.16% month-on-month, 24.55% year-on-year, and 7.46% year-on-year cumulatively. It is not difficult to observe that from the end of 2024 to the first half of 2025, many copper smelters in China commenced operations, releasing rough smelting capacity. The surge in copper concentrate imports driven by the sharp increase in demand was reasonable, but such a high import volume was still unexpected. Let's specifically analyze the main sources of this high-level copper concentrate imports.
Chile, Peru, & Mexico
- In April 2025, China imported 851,000 tons of copper concentrates from Chile, up 18.52% year-on-year; 786,800 tons from Peru, up 38.88% year-on-year; and 141,200 tons from Mexico, up 28.35% year-on-year.
- On one hand, according to SMM statistics, factors in the Americas such as the mining of sulfide ores at Mantoverde, the continuous capacity release of QB II, increased production at Antapaccay, the improvement in copper grade and flotation efficiency at Las Bambas, and increased output at Quellaveco have laid the material foundation for the level of copper concentrate exports from the Americas to China.
- On the other hand, from Q4 last year to Q1 this year, mines conducted more frequent bidding activities with traders/smelters, intensifying the logistics distribution of copper concentrates originating from the Americas. China's advantage in Treatment Charges (TC) has led to more copper concentrate shares flowing to China.
Democratic Republic of the Congo (DRC)
- In April 2025, China imported 94,000 tons of copper concentrates from the DRC, up 83.36% year-on-year. This year, the DRC government's export restrictions only target cobalt, not copper.
- Kamoa-Kakula is expected to increase copper production by 132,000 tons copper in metal in 2025. With the implementation of long-term and spot contracts between the KK mine and Chinese smelters, more copper from the DRC is flowing to the Chinese market.
Indonesia
- In April 2025, China imported 129,200 tons of copper concentrates from Indonesia, up 101.93% year-on-year. In March this year, the Indonesian government issued a six-month copper concentrate export license to Freeport Indonesia, allowing it to export copper concentrates during smelter maintenance, which ensures the Indonesian government continues to receive royalties.
- As a result, in April this year, Indonesian copper concentrates began to be allowed to flow to China, with shipping periods of about half a month. Notably, China's copper concentrate imports from Indonesia were zero in March this year.
Brazil
- In April 2025, China imported 66,400 tons of copper concentrates from Brazil, up 76.9% year-on-year. In November 2024, Vale tendered tens of thousands of tons of Sossego spot positions to traders, with loading periods including Q1 2025.
》Click to View the SMM Copper Industry Chain Database
![Overnight copper prices edged down, bulls cut positions; spot supply tightened, and the discount continued to narrow [SMM Copper Morning Meeting Minutes]](https://imgqn.smm.cn/usercenter/vdbfy20251217171709.jpg)